Physical Tracer Testing
A "tracer test" describes a general testing procedure wherein a passively transported substance (such as a dye or chemical) is used to probe the hydraulic characteristics of wastewater reactors. Many regulatory agencies request that tracer tests be done on contact basins to validate their hydraulic performance and ensure that adequate disinfection is attained.
Many different compounds can be used as tracers, provided it meets a specified set of characteristics, as outlined in Metcalf & Eddy AECOM (2014). The tracer must:
- Not affect the flow by having a similar density to the wastewater;
- Not react, such that a mass balance can be performed;
- Be able to be injected over a short time period;
- Be able to be detected and quantified easily;
- Have a low molecular diffusivity in water;
- Not be absorbed onto or react with the reactor surfaces or particles in the wastewater
Some examples of compounds that have been successfully used include:
- Congo red
- Fluorescein*
- Lithium chloride
- Pontacyl Brilliant Pink B*
- Rhodamine WT*
- Sodium chloride
Those marked with an asterisk (*) are by far the most commonly used compounds in wastewater treatment facilities, since they can be detected in very low concentrations.
Once the tracer compound is selected, it is injected into the inlet of the reactor/basin that is being tested and the tracer signal is measured downstream (usually at the outlet). There are two main injection schemes that can be followed. The first involves a short pulse injection of the tracer, resulting in a downstream pulse. The second injection scheme involves a constant injection of tracer, which results in the outlet concentration eventually reaching the inlet concentration. In both cases, the observed profile of the downstream tracer concentration is indicative of the reactor hydraulics. More often a pulse injection is used, since it requires less tracer.
Virtual Tracer Testing
A virtual tracer test can be described in an identical way to a physical tracer test, except that the hydraulics and tracer transport are solved using computational fluid dynamics (CFD) simulations. Since these are virtual, they have a number of distinct advantages, such as:
- They are quick and easy to set up and analyze for experienced CFD engineers.
- They are a non-invasive test that does not require any physical interventions to inject/monitor the tracer.
- They can be done before commissioning a plant to be built, preventing the potential need for retrofits later to correct problems with the hydraulics.
- The virtual tracer can be defined to be completely ideal. That is, it can be defined to be completely passive, non-reactive, and non-absorbing. It can be defined with an arbitrarily low diffusivity. It can be perfectly quantified.
While virtual tracer tests do not completely replace physical tracer tests, they can reduce the need for them in many cases. They are particularly advantageous in the design phase, since it allows a prediction of the actual tracer test before the reactor is even built. This is a major advantage, considering the costly implications of finding out about non-ideal hydraulics after the reactor is installed.
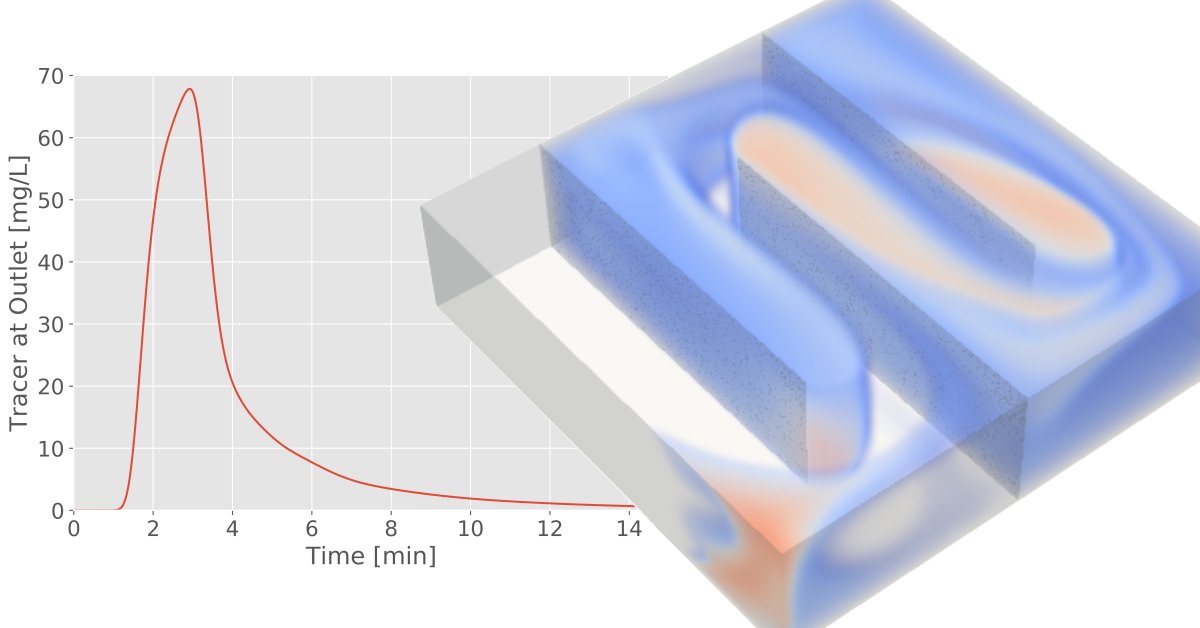
The video below shows a visualization of a virtual tracer test conducted on a baffled channel. Here, dead zones can be visualized on the outlet side of each baffle, where the flow is recirculating and the tracer can only escape by diffusion. Therefore, the residence time of the tracer in these areas is quite long. In other areas the tracer exits the domain much more quickly as the flow streamlines connect relatively simply from inlet to outlet.
Figure 1: Animation of the virtual tracer test results.
The results from the CFD-based virtual tracer test can also be evaluated in terms of the average tracer concentration at the outlet, as shown in the figure below. This particular reactor has a volume of 16 cubic metres and a volumetric flow rate of 5.3 cubic metres per minute. Therefore, the theoretical hydraulic retention time (HRT) is 3 minutes. The peak value in the tracer curve is indeed occurring close to 3 minutes, but the outlet tracer concentration remains high for several minutes, indicating a significant amount of tracer becomes trapped in recirculation zones and has difficulty escaping the reactor.

Figure 2: Plot of the tracer outlet concentration as a function of time.
Interpreting Tracer Response Curves
Using the example above, the standard performance indicators outlined in Metcalf & Eddy AECOM (2014), will be computed. The theoretical HRT is the ratio of the reactor volume (V) and the volume flow rate (Q), and is defined as
\tau = \frac{V}{Q} = 3\text{ min}The time at which the tracer first appears is denoted t_i. In this case, taking a minimum threshold value of 0.1 mg/L for detecting tracer, t_i = 1.0 min. The time when the peak concentration is observed is called t_p, which in this case is 2.9 min. Normally t_p is expected to be close to \tau
It is also common to compute the times at which a particular percentile of the tracer has passed through the reactor. Most commonly these are the 10th, 50th, and 90th percentiles. For this example, these values are:
t_{10} = 2.0\text{ min}t_{50} = 3.1\text{ min}t_{90} = 7.1\text{ min}Based on the percentile values, the Morrill Dispersion Index (MDI) is defined as:
\text{MDI} = \frac{t_{90}}{t_{10}} = 3.5The MDI represents overall dispersion of the tracer by the time it reaches the outlet. Qualitatively, it represents with width of the tracer curve. The value of MDI for an ideal plug flow reactor is 1.0 (no axial dispersion) and is considered acceptable if the value is less than 2.0. Therefore, the design under consideration here should be re-evaluated if the intention is for it to be used as a contact basin for disinfection. The results show that there is too much variation in the contact time, which would lead to inconsistent disinfection performance.
From the MDI, the volumetric efficiency can be calculated as:
\text{Volumetic efficiency} = \frac{1}{\text{MDI}} \times 100\% = 29\%The volumetric efficiency indicates how well the available reactor volume is being put to use. The maximum volumetric efficiency (100\%) is attained when the MDI is 1.0 for a plug flow reactor. This corresponds to the theoretical case where t_{10} = t_{90}, indicating minimal dispersion of the tracer and nearly uniform contact time for all fluid exiting the domain.
In reactor design, it is important to avoid "short-circuiting" where some of the fluid is able to reach the outlet on a path that is shorter than intended, resulting in a lower retention time. Baffles are a common technique for avoiding short-circuiting by forcing the fluid to traverse around the baffles. An indication of short-circuiting in the reactor can be found by looking at the ratio t_{10}/\tau. The value for an ideal plug flow reactor is 1.0. In this case, the value is 0.67, which indicates minimal short-circuiting.
The non-uniformity of the flow in the reactor can be assessed using the ratio t_{p}/\tau, which is called the "index of modal retention time". The value in this case is 0.97 and the value for an ideal plug flow reactor is 1.0. Therefore it can be concluded that the the flow is fairly uniform.
The skew of the tracer curve can be assessed using the "index of mean retention time", which is defined as t_{50}/\tau. A value greater than 1.0 indicates a tracer curve that is skewed to the right, while a value less than 1.0 indicates skew to the left. The value in this case is 1.03, indicating a slight skew to the right. In the ideal case, the tracer curve should closely approximate a Gaussian curve with no skew.
Next Steps
Virtual tracer testing is a powerful tool in the design of reactors and contact basins. With a few simple simulations, a wealth of information can be extracted about the effectiveness of a particular design, and give indications about how it can be improved. That being said, the ability to accurately perform CFD simulations according to industry best practices, is not something that can be learned quickly. Maple Key Labs specializes in conducting virtual tracer studies on our clients' designs. For more information on how we can help, fill out the form on the Contact Us page. For those that want to bring the analysis in-house, we are also available for consultations to ensure clients get started in the right way. By subscribing to our newsletter, you can keep up to date with articles like this.
References
Metcalf & Eddy AECOM (2014) Wastewater Engineering: Treatment and Resource Recovery. 5th Edition, McGraw-Hill, New York.
About the Author
Chris DeGroot, PhD, PEng, is the co-founder and CEO of Maple Key Labs. He is a leading figure in the promotion of CFD in Canada, having served on the Board of Directors of the CFD Society of Canada (CFDSC) for a number of years. Through his work with CFDSC, he served as Chair of the society's national conference in 2019, which was hosted in London, Ontario. He has been working in the field of CFD for more than 14 years, starting during his undergraduate studies. He earned his PhD in 2012 from Western University, after which he held a postdoctoral research fellowship at the University of Waterloo, in conjunction with ANSYS Canada. Starting in 2014 he began a journey to further develop the usage of CFD in the water industry through his work as a research scientist at Trojan Technologies. In 2016 he was appointed as Assistant Professor at Western University where he carried this interest through his research program to the present day. He is a current member of the International Water Association's (IWA) CFD Working Group and a member of the Water Environment Federation's Program Committee, which organizes the technical program of the WEFTEC conference. He is actively involved in the IWA's efforts to support Young Water Professionals (YWPs). In 2019 he co-Chaired the International YWP Conference in Toronto, Ontario and is currently the Treasurer of the IWA Canadian YWP Chapter.